Figure 1.1
How have data science salaries evolved globally from 2020 to 2025, and what historical industry disruption contributed to these changes?
Over the past five years, the global landscape of data science salaries has undergone significant transformations marked by historical industry disruptions. We decided to create three graphs to see exactly when in time, what kind of jobs, and where regionally was the most affected.
In using a boxplot, we can visualize general statistics about our dataset. These boxplots [Figure 1.1] show average salary (in USD) for each work year from 2020 to 2025. A key initial adjustment was the removal of an extreme outlier, an entry of $450,000 under Research from the Americas in 2020, which was done to improve readability. There was a general increase in median salary, with dips in 2021 and 2025. After 2021, median salaries stayed above $80,000. The largest IQR and range was in 2023 with the smallest IQR and range in 2021. The outlier in 2020 belongs to an entry from the Americas for $189,213 under Data Science. The outliers in 2021 belong to two entries from the Americas, one for $178,170 under Other, the other for $143,747 under Data Engineering. The outlier in 2024 belongs to an entry from Europe for $236,101 under Research.
Overall, median salaries exhibited a rising trend throughout the period despite the noticeable dips in 2021 and 2025. Notably, salaries after 2021 consistently remained above $80,000, signaling long-term gains likely fueled by remote work adoption and heightened demand for skilled individuals following the COVID-19 Pandemic (Timeline). 2023 has the largest IQR, this indicates a broader variability in salary. In contrast, 2021 had the smallest IQR, suggesting a reduced dispersion after the pandemic. The outliers may reflect the high demand of data science roles tied to digital advancements in the post-pandemic recovery.
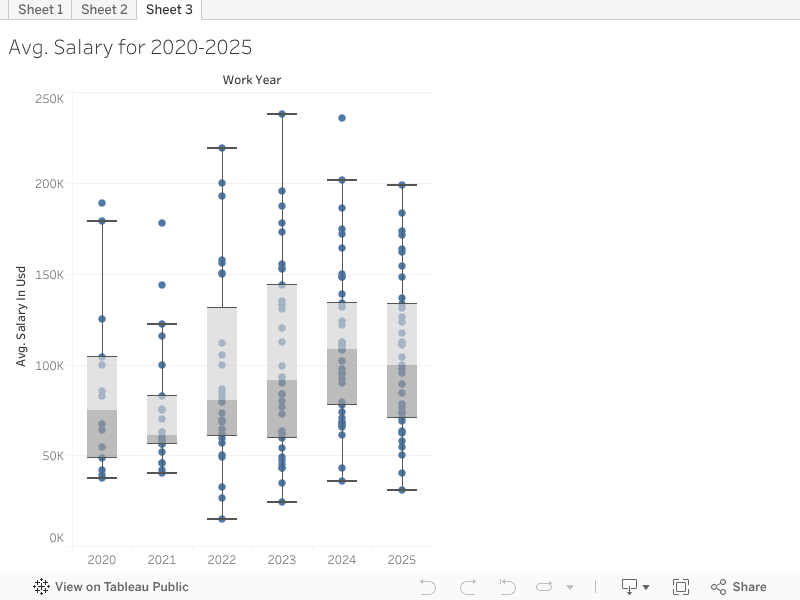
In using a bar chart [Figure 1.2] to show average salary by job category for each work year, we are able to see which job categories gained the most over time. Analytics had a general increase then a jump in 2022 with steady numbers after, the averages ranged from $68,000 to $108,000. BI & Reporting had a low in 2022 but a jump in 2023 with steady numbers after, the averages ranged from $105,000 to $152,000. Data Engineering saw a significant jump in 2022 with noticeable increases after, the averages ranged from $90,000 to $169,000. Data management has a huge jump in 2023 with steady numbers after, the averages ranged from $84,000 to $127,000. Data Science experiences a dip in 2021 then a large jump in 2022 and 2023 then a slight decrease after, the averages ranged from $91,000 to $165,000. Product & QA had a jump in 2024 with steady numbers after, the averages ranged from $137,000 to $182,000.
Research was a leading salary in 2020 having the average be $246,000, but it experienced a major dip down to $77,000 in 2021 then up to $141,000 then on an increase after. Software/Dev had a low in 2021 then a huge increase in 2022 then a downwards trend after, the averages ranged from $61,000 to $165,000. The Other category experienced an upward trend up to 2023 then steady numbers after, the averages ranged from $124,000 to $174,000. Overall, data science roles experienced moderate growth, with some stagnation, likely tied to the broader adoption of AI, ML, and Visualization tools to provide better insight to decision-making across industries (Timeline). This reveals the increasing centrality in these careers and its accelerated valuation. For Research, its highest salary being in 2020 could be inflated due to pandemic funding and urgent innovation since it plummeted and has recovered since.
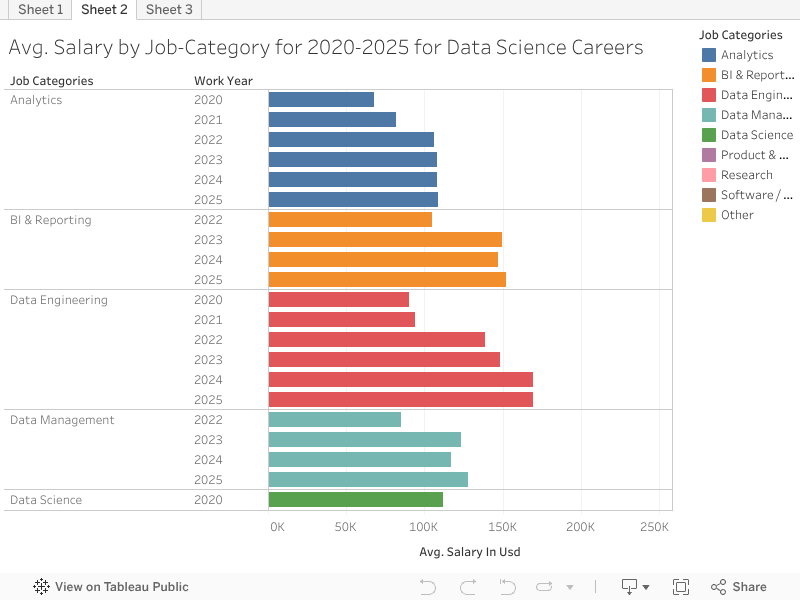
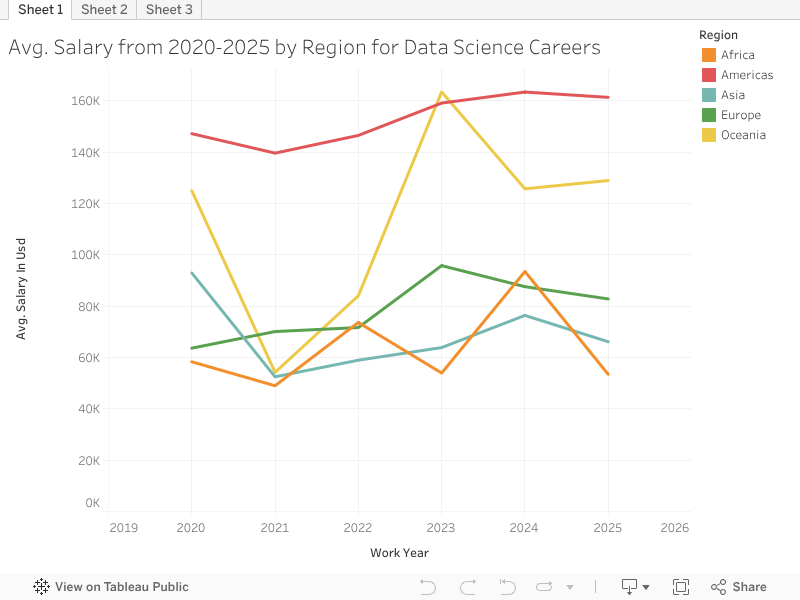
Figure 1.3
In using a line graph, we are able to clearly see salary growth patterns over time. This line graph [Figure 1.3] shows average salary (in USD) over the 5 year span separated by Regions. Africa had very unsteady trends of positive and negative growths ranging from $49,000 in 2021 to $93,000 in 2024. The Americas had a steady slight increase ranging from $139,000 in 2021 to $163,000 in 2024. Asia experienced a strong decrease but a slight increase after with a range of $52,000 in 2021 to $92,000 in 2020. Europe had a constant increase with a low of $63,000 in 2020 to a high of $95,000 in 2023. Finally, Oceania experienced unsteady values with a hard fall in 2021 of $54,000 from $125,000 in 2020 but has a high in 2023 of $163,000 then a fall down to $125,000. Overall, looking at the Americas, this region stayed high above the over regions over the past 5 years, especially in 2021 with the lowest gap being $69,000 from Europe and the highest gap being $90,000 from Africa.
The highly erratic trends for Africa likely reflect economic instability. The Americas displayed the steadiest and highest progression across all regions, this consistent growth implies a strong market and stable pathway for high-paying roles. Asia’s sudden drop after 2020 could be pandemic-related, which may hint to outsourcing shifts or inconsistencies in valuation of data science roles (Timeline). Europe has a smooth and upward journey, having a sustainable growth could have come from industry investments and attraction of talent. For Oceania, the dramatic fluctuations can be linked to certain industry dynamics of the region. In comparison of regions to the Americas, it is clear that there are structural advantages and a rich job market there.
The most significant historical disruption influencing global data science salary evolution has to be the COVID-19 Pandemic (Timeline). With its rise in remote work normalization, digital transformation surge, shifts in investments, and greater talent opportunities, the pandemic served as a stimulus for data science careers.
To what extent has the rise of remote work impacted regional salary gaps in the data science field?
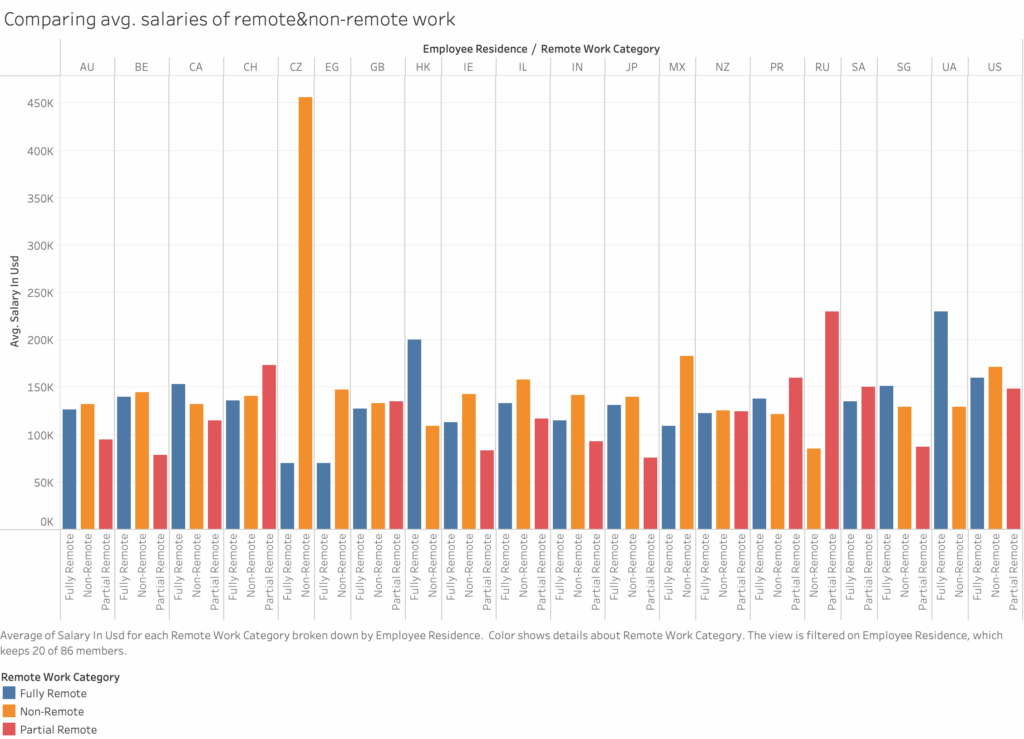
Over the past several years, remote work has increasingly transformed the global data science job market, with significant repercussions for salary structures and employment opportunities worldwide. This analysis examines the differences in average salaries between fully remote and non-remote data science roles across various countries, aiming to understand how the shift to remote work is influencing compensation patterns.
The bar chart at the center of this comparison highlights clear trends: average salaries for data scientists remain the highest in established technology hubs such as the United States and Western Europe. These regions continue to attract and reward top talent, reflecting their mature ecosystems for technology companies and established infrastructure for digital work. However, the impact of remote work is evident in countries outside these core hubs as well. In places like Canada, New Zealand, and the United Kingdom—nations that have quickly adopted remote working practices—modest salary gains for remote workers suggest that some regional wage gaps are narrowing, though not disappearing altogether. This points to a landscape where geographic boundaries are less restrictive but still play a role in determining pay.
Nevertheless, notable disparities persist, especially in Eastern European, Latin American, and certain Asian markets such as the Czech Republic. In these countries, data science professionals’ average salaries remain substantially lower than those in the US, regardless of remote or on-site status. This highlights the fact that while remote work can provide greater access to high-paying jobs for talent located in less traditional tech hubs, it does not fully erase the longstanding regional differences rooted in economic conditions, cost of living, and local demand for data science expertise.
Interestingly, the data reveals that, on average, fully remote data scientists tend to earn more than their non-remote peers, both within and outside the most competitive markets. This may be attributed to companies offering global salaries to attract scarce technical talent, and skilled professionals taking advantage of remote work to seek higher-paying positions outside their home countries. However, exceptions exist: in some regions, particularly where local companies are less connected to the global remote hiring trend, non-remote workers may still command higher salaries due to limited supply or the prestige of in-office roles.
In conclusion, while remote work has helped to lift the salary floor for data science professionals around the world by expanding access to well-compensated opportunities, it has not yet eliminated structural inequalities or closed absolute regional compensation gaps.


The map reveals clear geographic and infrastructural disparities: China, the United States, and parts of Western Europe dominate renewable energy production, while many countries in Sub-Saharan Africa and Southeast Asia produce far less despite having significant renewable resource potential. This visualization reflects how historical industrial capacity, infrastructure investment, and policy incentives shape where renewable energy is most heavily produced. Additionally, countries with smaller economies or political instability often produce lower amounts, underscoring the intersections of economic development, governance, and environmental transitions. This is significant to our project as it demonstrates how the global push toward renewables can reproduce inequalities, with high-capacity countries continuing to dominate energy transitions while lower-capacity countries risk being left behind.
This analysis connects to Timmons Roberts and Parks’ (2007) work on climate injustice, where they argue that while the impacts of climate change are global, the capacities to mitigate and adapt are deeply unequal, often leaving low-income countries with limited access to energy transitions (Roberts & Parks, 2007). Our map exemplifies this by illustrating how renewable energy production, while essential for climate action, is currently concentrated in wealthier nations, reflecting and reinforcing global inequalities in environmental action and benefit.
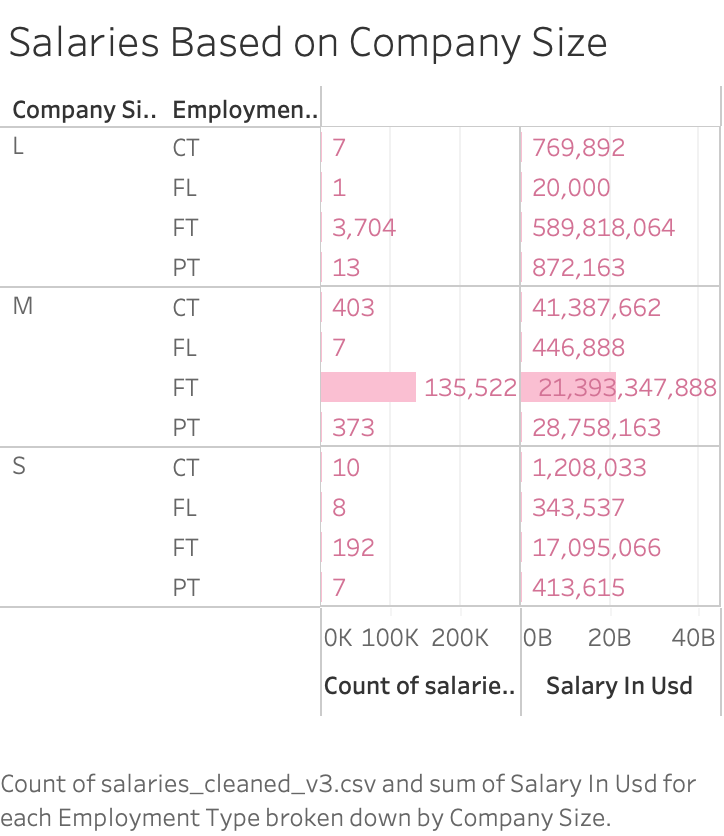
How does salary differ across job titles, experience levels, and employment types, and what does this reveal about hierarchical systems, professional mobility, and changing norms in the digital workforce?
The bar chart shows the different experience levels and their respective salaries. It depicts the amount of jobs for each different experience level and the total gross income for those roles. It displays how much experience individuals have and coincides with their income. This bar chart is based on the amount of experience an individual has working in their data career and their salary. Individuals are grouped based on whether they are a senior (SE), mid level (MI), entry level (EN), or executive (EX). We can see from the chart there are the most senior level employees, followed by mid level employees. Senior level employees are also responsible for the most income and mid level employees come after that. What was surprising were that executives had the smallest combined income when compared to the rest of the experience levels. Although executives had the lowest combined salaries, it came quite close to entry level employees even though there were quite a bit more of entry level employees. I initially thought that executives would make the most money, followed by senior level, mid level, and lastly entry level. It was interesting to see that senior level employees accounted for the most income, followed by mid level, entry level, and lastly executives. A huge attribute of this is due to executives comprising the least amount of employees. What was interesting to see was that there were quite a lot more entry level employees than executives, but executives’ salaries came quite close to entry level employees’ salaries. This could reaffirm my hypothesis that executives get paid a large amount in comparison to other roles. It also reaffirmed that although there are the least amount of executives, they do get paid the most in comparison to other roles.
As highlighted in Chen et al. (2023), higher level roles like machine learning engineers and senior data professionals not only earn more individually but tend to experience faster salary growth over time due to their strategic importance and leadership responsibilities. The concentration of income among senior-level employees, as shown in the chart, reflects this dynamic where the most experienced professionals receive the greatest share of compensation, reinforcing a hierarchical reward structure. Even though executives earn high individual salaries, their overall contribution to total salary expenditure is limited due to their small numbers, whereas senior employees both outnumber and out-earn other groups in aggregate. This suggests that within the digital workforce, salary is not evenly distributed by skill or contribution alone but is deeply shaped by position within the professional hierarchy. These disparities mirror larger systems of power that prioritize experience and leadership over equity and access.